tags: heapster
部署 heapster 插件
到 heapster release 页面 下载最新版本的 heapster
$ wget https://github.com/kubernetes/heapster/archive/v1.3.0.zip
$ unzip v1.3.0.zip
$ mv v1.3.0.zip heapster-1.3.0
$
官方文件目录: heapster-1.3.0/deploy/kube-config/influxdb
$ cd heapster-1.3.0/deploy/kube-config/influxdb
$ ls *.yaml
grafana-deployment.yaml  heapster-deployment.yaml  heapster-service.yaml  influxdb-deployment.yaml
grafana-service.yaml     heapster-rbac.yaml        influxdb-cm.yaml       influxdb-service.yaml
- 新加了
heapster-rbac.yaml和influxdb-cm.yaml文件,分别定义 RoleBinding 和 inflxudb 的配置;
已经修改好的 yaml 文件见:heapster。
配置 grafana-deployment
$ diff grafana-deployment.yaml.orig grafana-deployment.yaml
16c16
<         image: gcr.io/google_containers/heapster-grafana-amd64:v4.0.2
---
>         image: lvanneo/heapster-grafana-amd64:v4.0.2
40,41c40,41
<           # value: /api/v1/proxy/namespaces/kube-system/services/monitoring-grafana/
<           value: /
---
>           value: /api/v1/proxy/namespaces/kube-system/services/monitoring-grafana/
>           #value: /
- 如果后续使用 kube-apiserver 或者 kubectl proxy 访问 grafana dashboard,则必须将
GF_SERVER_ROOT_URL设置为/api/v1/proxy/namespaces/kube-system/services/monitoring-grafana/,否则后续访问grafana时访问时提示找不到http://10.64.3.7:8086/api/v1/proxy/namespaces/kube-system/services/monitoring-grafana/api/dashboards/home页面;
配置 heapster-deployment
$ diff heapster-deployment.yaml.orig heapster-deployment.yaml
13a14
>       serviceAccountName: heapster
16c17
<         image: gcr.io/google_containers/heapster-amd64:v1.3.0-beta.1
---
>         image: lvanneo/heapster-amd64:v1.3.0-beta.1
- 使用的是自定义的、名为 heapster 的 ServiceAccount;
配置 influxdb-deployment
influxdb 官方建议使用命令行或 HTTP API 接口来查询数据库,从 v1.1.0 版本开始默认关闭 admin UI,将在后续版本中移除 admin UI 插件。
开启镜像中 admin UI的办法如下:先导出镜像中的 influxdb 配置文件,开启 admin 插件后,再将配置文件内容写入 ConfigMap,最后挂载到镜像中,达到覆盖原始配置的目的。相关步骤如下:
注意:无需自己导出、修改和创建 ConfigMap,可以直接使用放在 manifests 目录下的 ConfigMap 文件。
$ # 导出镜像中的 influxdb 配置文件
$ docker run --rm --entrypoint 'cat'  -ti lvanneo/heapster-influxdb-amd64:v1.1.1 /etc/config.toml >config.toml.orig
$ cp config.toml.orig config.toml
$ # 修改:启用 admin 接口
$ vim config.toml
$ diff config.toml.orig config.toml
35c35
<   enabled = false
---
>   enabled = true
$ # 将修改后的配置写入到 ConfigMap 对象中
$ kubectl create configmap influxdb-config --from-file=config.toml  -n kube-system
configmap "influxdb-config" created
$ # 将 ConfigMap 中的配置文件挂载到 Pod 中,达到覆盖原始配置的目的
$ diff influxdb-deployment.yaml.orig influxdb-deployment.yaml
16c16
<         image: gcr.io/google_containers/heapster-influxdb-amd64:v1.1.1
---
>         image: lvanneo/heapster-influxdb-amd64:v1.1.1
19a20,21
>         - mountPath: /etc/
>           name: influxdb-config
22a25,27
>       - name: influxdb-config
>         configMap:
>           name: influxdb-config
配置 monitoring-influxdb Service
$ diff influxdb-service.yaml.orig influxdb-service.yaml
12a13
>   type: NodePort
15a17,20
>     name: http
>   - port: 8083
>     targetPort: 8083
>     name: admin
- 定义端口类型为 NodePort,额外增加了 admin 端口映射,用于后续浏览器访问 influxdb 的 admin UI 界面;
执行所有定义文件
$ pwd
/root/heapster-1.3.0/deploy/kube-config/influxdb
$ ls *.yaml
grafana-deployment.yaml  heapster-deployment.yaml  heapster-service.yaml  influxdb-deployment.yaml
grafana-service.yaml     heapster-rbac.yaml        influxdb-cm.yaml       influxdb-service.yaml
$ kubectl create -f  .
$
检查执行结果
检查 Deployment
$ kubectl get deployments -n kube-system | grep -E 'heapster|monitoring'
heapster               1         1         1            1           1m
monitoring-grafana     1         1         1            1           1m
monitoring-influxdb    1         1         1            1           1m
检查 Pods
$ kubectl get pods -n kube-system | grep -E 'heapster|monitoring'
heapster-3273315324-tmxbg               1/1       Running   0          11m
monitoring-grafana-2255110352-94lpn     1/1       Running   0          11m
monitoring-influxdb-884893134-3vb6n     1/1       Running   0          11m
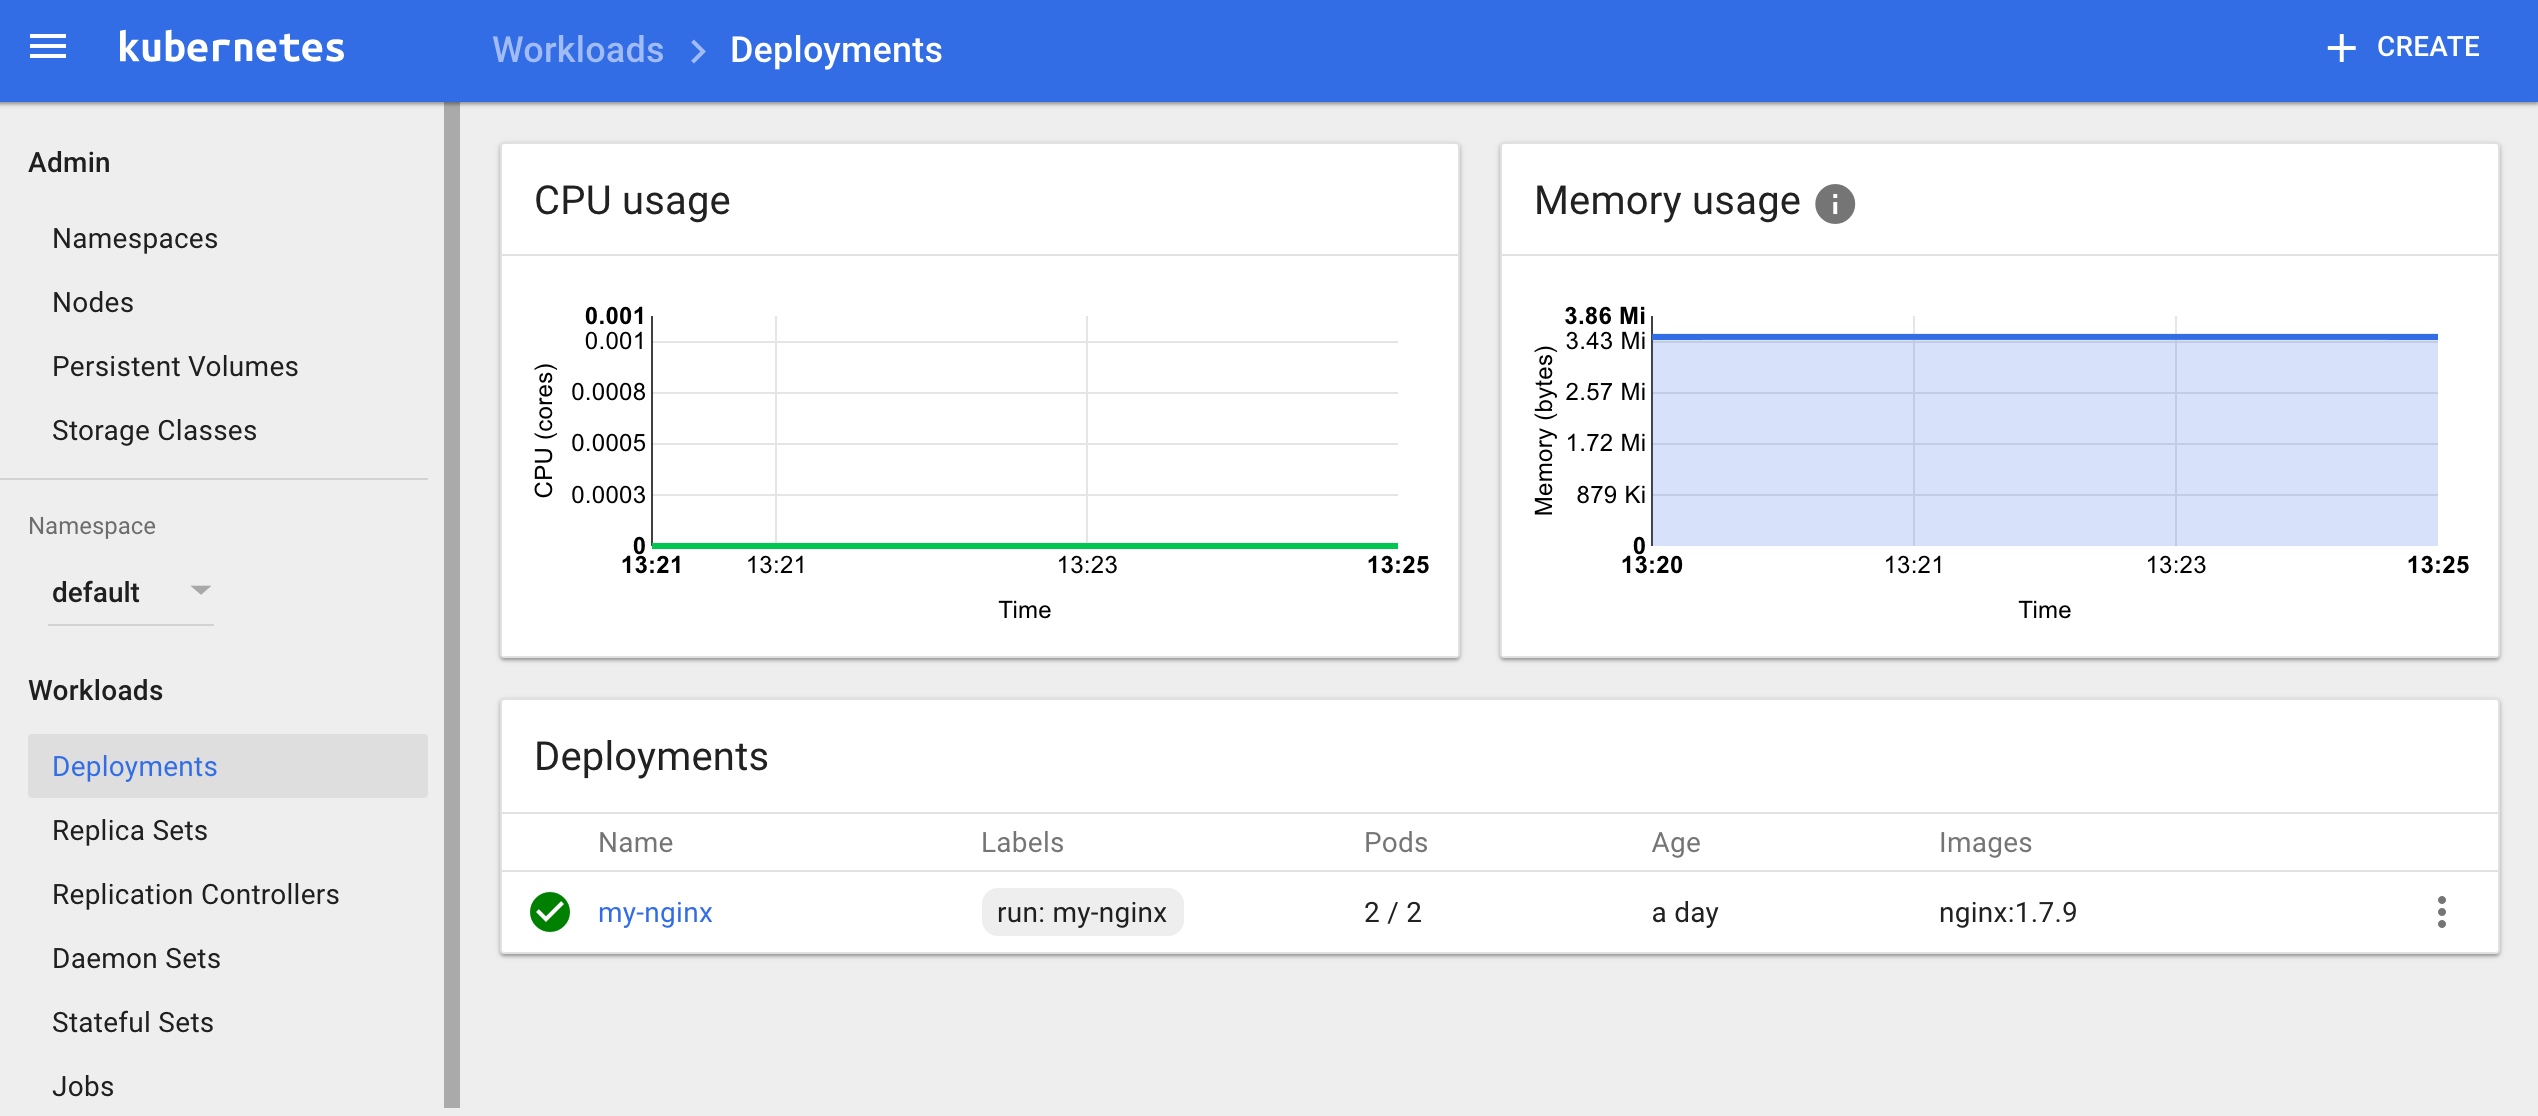
检查 kubernets dashboard 界面,看是显示各 Nodes、Pods 的 CPU、内存、负载等利用率曲线图;
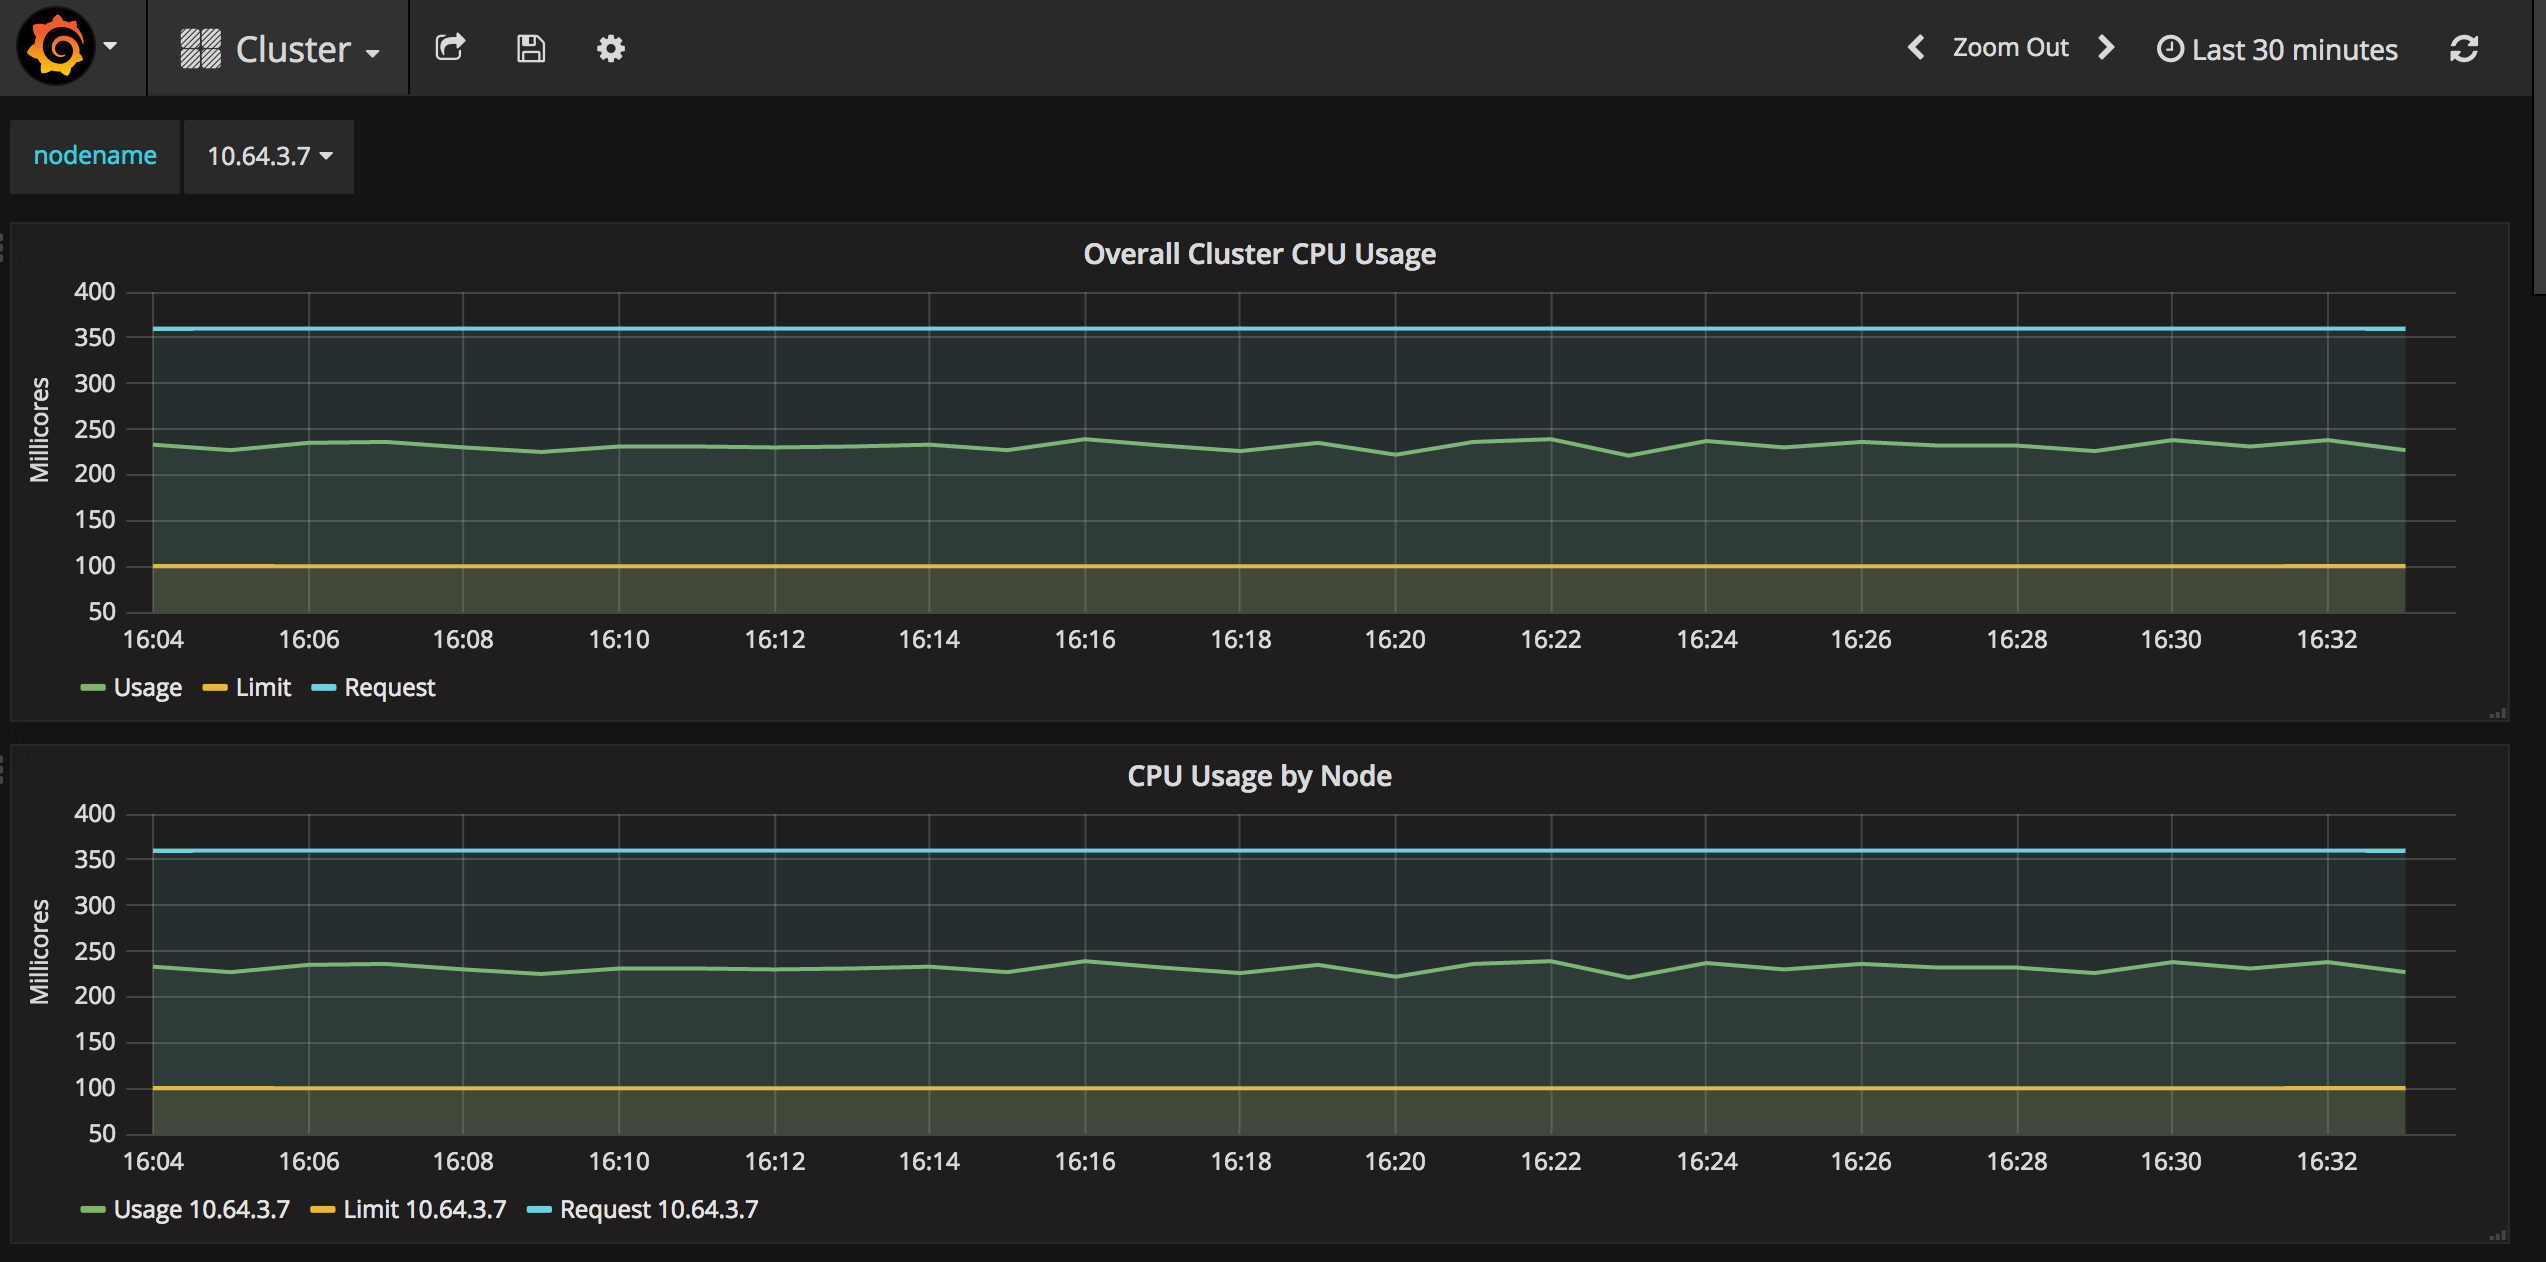
访问 grafana
-
通过 kube-apiserver 访问:
获取 monitoring-grafana 服务 URL
$ kubectl cluster-info
Kubernetes master is running at https://10.64.3.7:6443
Heapster is running at https://10.64.3.7:6443/api/v1/proxy/namespaces/kube-system/services/heapster
KubeDNS is running at https://10.64.3.7:6443/api/v1/proxy/namespaces/kube-system/services/kube-dns
kubernetes-dashboard is running at https://10.64.3.7:6443/api/v1/proxy/namespaces/kube-system/services/kubernetes-dashboard
monitoring-grafana is running at https://10.64.3.7:6443/api/v1/proxy/namespaces/kube-system/services/monitoring-grafana
monitoring-influxdb is running at https://10.64.3.7:6443/api/v1/proxy/namespaces/kube-system/services/monitoring-influxdb
$
由于 kube-apiserver 开启了 RBAC 授权,而浏览器访问 kube-apiserver 的时候使用的是匿名证书,所以访问安全端口会导致授权失败。这里需要使用非安全端口访问 kube-apiserver:
浏览器访问 URL:
http://10.64.3.7:8080/api/v1/proxy/namespaces/kube-system/services/monitoring-grafana -
通过 kubectl proxy 访问:
创建代理
$ kubectl proxy --address='10.64.3.7' --port=8086 --accept-hosts='^*$'
Starting to serve on 10.64.3.7:8086
浏览器访问 URL:
http://10.64.3.7:8086/api/v1/proxy/namespaces/kube-system/services/monitoring-grafana
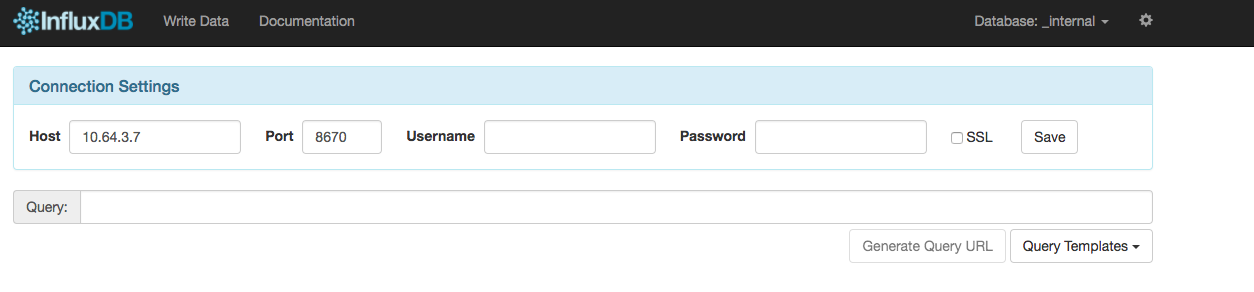
访问 influxdb admin UI
获取 influxdb http 8086 映射的 NodePort
$ kubectl get svc -n kube-system|grep influxdb
monitoring-influxdb    10.254.255.183   <nodes>       8086:8670/TCP,8083:8595/TCP   21m
通过 kube-apiserver 的非安全端口访问 influxdb 的 admin UI 界面: http://10.64.3.7:8080/api/v1/proxy/namespaces/kube-system/services/monitoring-influxdb:8083/
在页面的 “Connection Settings” 的 Host 中输入 node IP, Port 中输入 8086 映射的 nodePort 如上面的 8670,点击 “Save” 即可: