seaborn.distplot
seaborn.distplot(a, bins=None, hist=True, kde=True, rug=False, fit=None, hist_kws=None, kde_kws=None, rug_kws=None, fit_kws=None, color=None, vertical=False, norm_hist=False, axlabel=None, label=None, ax=None)
灵活绘制单变量观测值分布图。
该函数结合了matplotlib中的 hist函数(自动计算一个默认的合适的bin大小)、seaborn的kdeplot()和rugplot()函数。它还可以拟合scipy.stats分布并在数据上绘制估计的PDF(概率分布函数)。
参数:a:Series、1维数组或者列表。
观察数据。如果是具有
name属性的Series对象,则该名称将用于标记数据轴。
bins:matplotlib hist()的参数,或None。可选参数。
直方图bins(柱)的数目,若填None,则默认使用Freedman-Diaconis规则指定柱的数目。
hist:布尔值,可选参数。
是否绘制(标准化)直方图。
kde:布尔值,可选参数。
是否绘制高斯核密度估计图。
rug:布尔值,可选参数。
是否在横轴上绘制观测值竖线。
fit:随机变量对象,可选参数。
一个带有fit方法的对象,返回一个元组,该元组可以传递给pdf方法一个位置参数,该位置参数遵循一个值的网格用于评估pdf。
{hist, kde, rug, fit}_kws:字典,可选参数。
底层绘图函数的关键字参数。
color:matplotlib color,可选参数。
可以绘制除了拟合曲线之外所有内容的颜色。
vertical:布尔值,可选参数。
如果为True,则观测值在y轴显示。
norm_hist:布尔值,可选参数。
如果为True,则直方图的高度显示密度而不是计数。如果绘制KDE图或拟合密度,则默认为True。
axlabel:字符串,False或者None,可选参数。
横轴的名称。如果为None,将尝试从a.name获取它;如果为False,则不设置标签。
label:字符串,可选参数。
图形相关组成部分的图例标签。
ax:matplotlib axis,可选参数。
若提供该参数,则在参数设定的轴上绘图。
返回值:ax:matplotlib Axes
返回Axes对象以及用于进一步调整的绘图。
另请参见
显示具有核密度估计图的单变量或双变量分布。
绘制小的垂直线以显示分布中的每个观测值。
范例
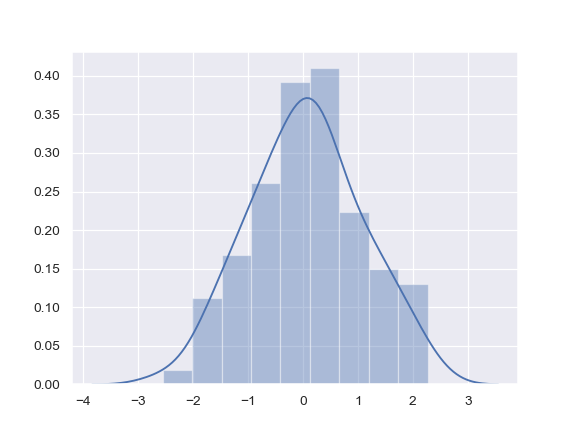
显示具有核密度估计的默认图和使用参考规则自动确定bin大小的直方图:
>>> import seaborn as sns, numpy as np
>>> sns.set(); np.random.seed(0)
>>> x = np.random.randn(100)
>>> ax = sns.distplot(x)
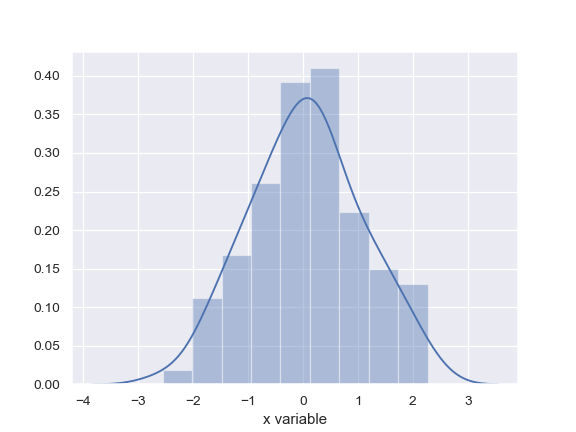
使用Pandas对象获取信息轴标签:
>>> import pandas as pd
>>> x = pd.Series(x, name="x variable")
>>> ax = sns.distplot(x)
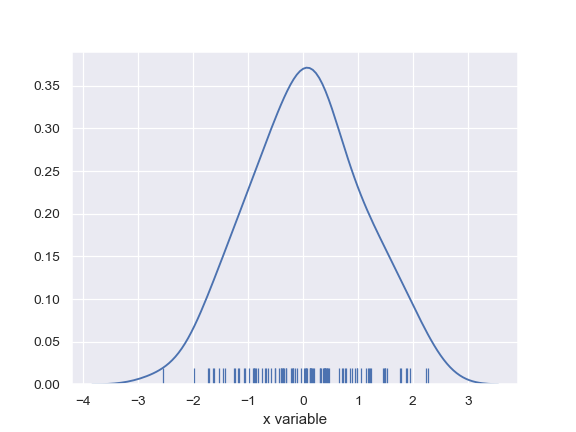
使用核密度估计和小的垂直线绘制分布图:
>>> ax = sns.distplot(x, rug=True, hist=False)
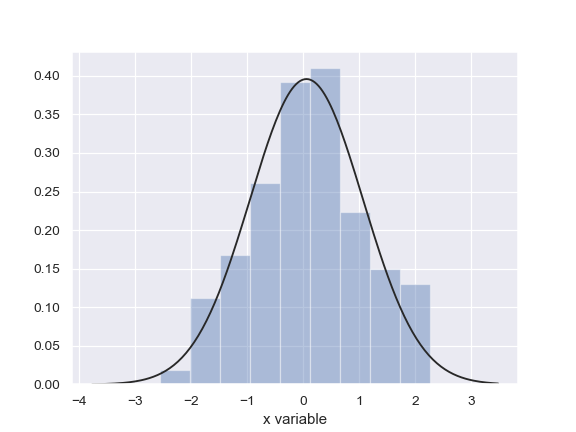
使用直方图和最大似然高斯分布拟合绘制分布图:
>>> from scipy.stats import norm
>>> ax = sns.distplot(x, fit=norm, kde=False)
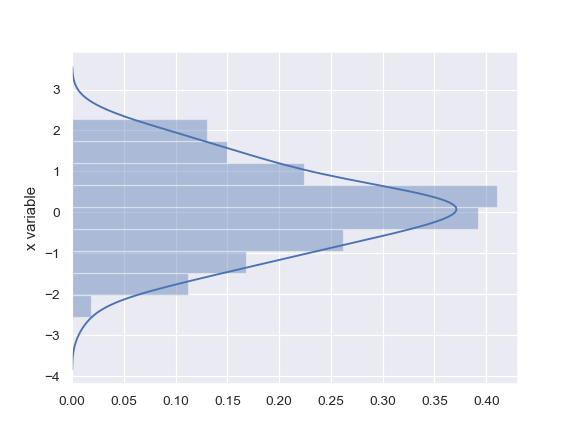
在垂直轴上绘制分布图:
>>> ax = sns.distplot(x, vertical=True)
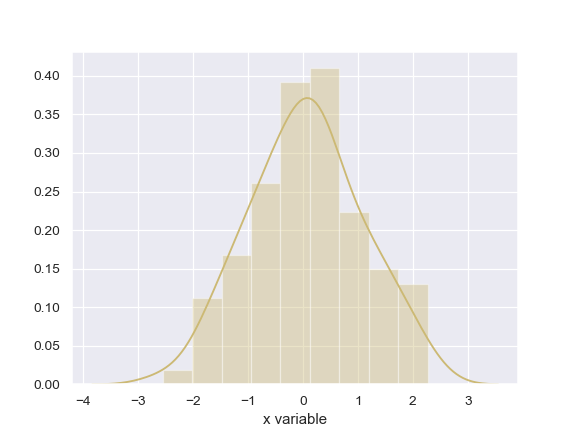
更改所有绘图元素的颜色:
>>> sns.set_color_codes()
>>> ax = sns.distplot(x, color="y")
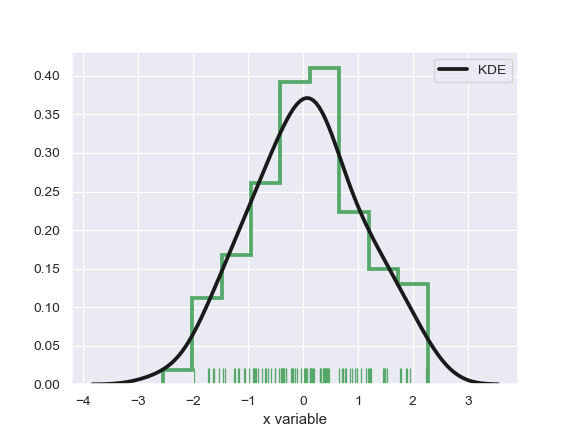
将特定参数传递给基础绘图函数:
>>> ax = sns.distplot(x, rug=True, rug_kws={"color": "g"},
...                   kde_kws={"color": "k", "lw": 3, "label": "KDE"},
...                   hist_kws={"histtype": "step", "linewidth": 3,
...                             "alpha": 1, "color": "g"})